Last updated: April 17, 2024
Available with any of the following subscriptions, except where noted:
|
|
|
|
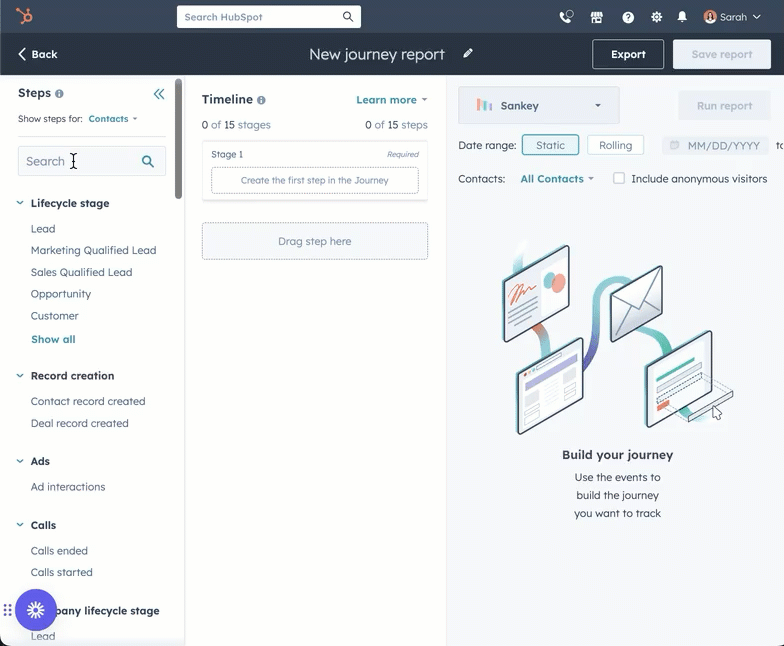
Create a report with journey analytics to view the impact of every interaction a contact has with your business and find out which touchpoints work best for attracting customers.
Journey reports are a series of stages. In each stage, there are steps that the contact or deal must complete to move to the next stage in the journey. Contacts or deals that complete all stages in the journey are counted toward the journey’s conversion rate.
You can choose from two data sources when creating a journey report; contacts (Marketing Hub Enterprise only) and deals (Sales Hub Enterprise only).
Learn more about common steps and filters in customer journey reports.
- You can add up to fifteen stages and up to fifteen unique steps. For example, you could set fifteen stages and include five different steps in the first stage, second stage, and third stage for a total of fifteen unique steps.
- You can analyze up to five years of data or up to twenty million unique events. If the report is configured where there's more than 20,000,001+ events, the date range window will reduce to one month.
Create a journey report
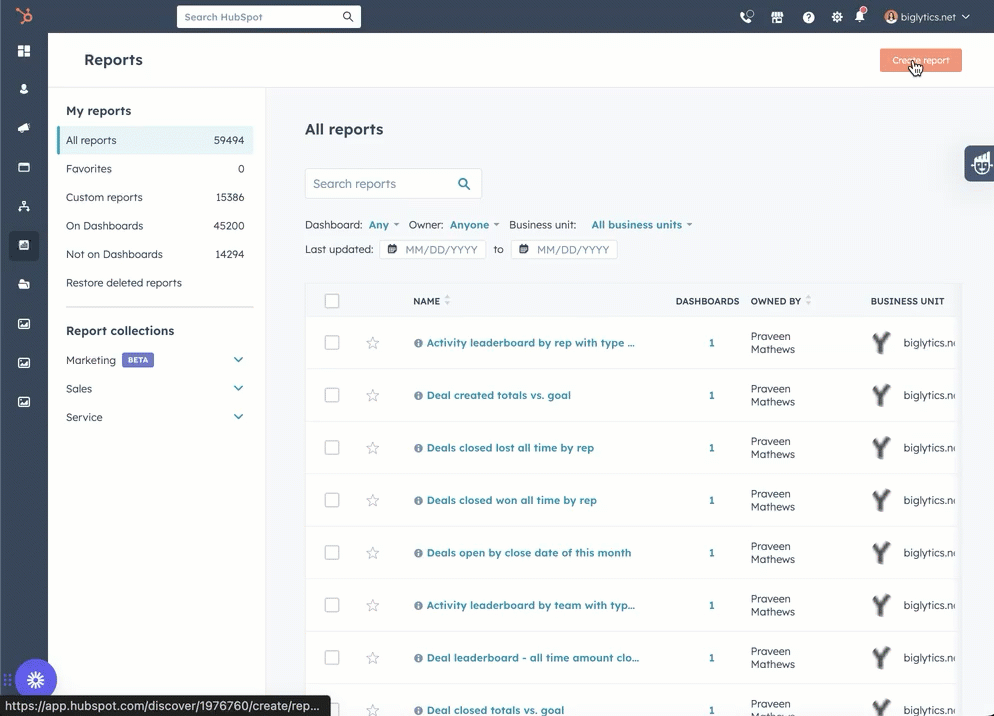
- In your HubSpot account, navigate to Reporting & Data > Reports.
- In the upper right, click Create report.
- In the Create reports from scratch section, select Customer Journey Reports.
- Select a data source.
- Contacts (Marketing Hub Enterprise only): select Contacts to measure how your content creates new contacts.
- Deals (Sales Hub Enterprise only): select Deals to measure how your content creates new deal opportunities.
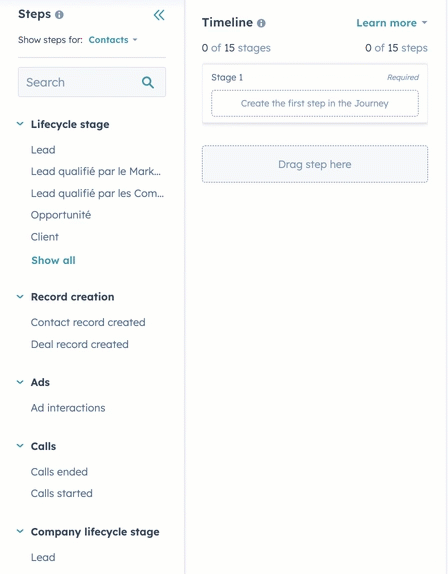
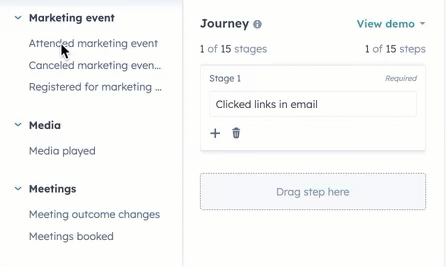
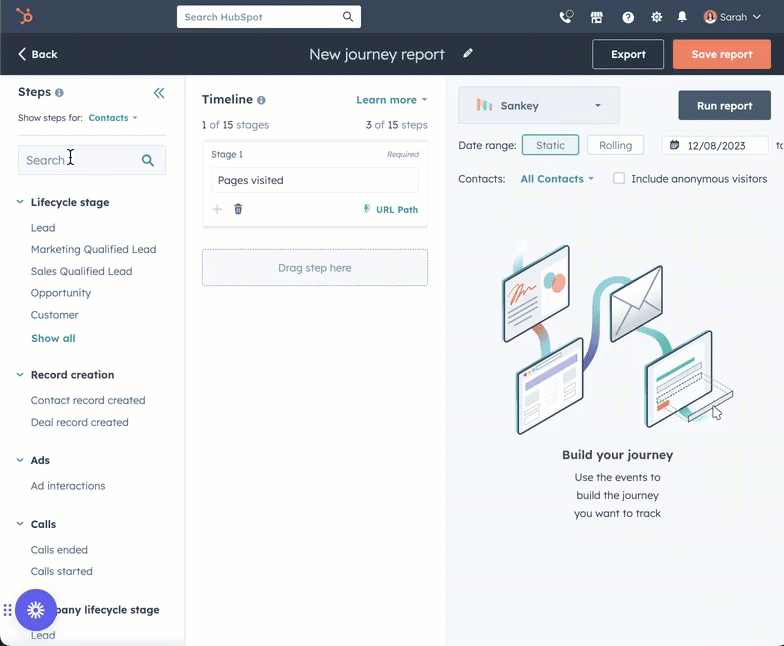
- Click and drag Steps from the left panel to the middle Timeline panel. Hover over the stage to view an estimate of the count of events in the set time period. Learn more about common steps in customer journey reports.
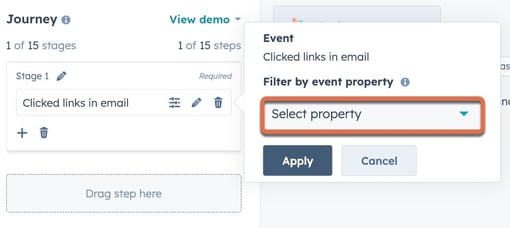
- There are two ways to filter the step you selected. If filtering is available for the selected step you can:
- Click the filter icon.
- Click the dropdown menu to select a property to filter by, configure the filter, and click Apply.
- Break down property icon:
- To get a more detailed analysis of the journey, click the Break down by property icon.
- Click the dropdown menu to select a property you want to break down. When the report has run, the most common pathways between the two stages will be displayed.
- Select the number of results to display in the report, and click Apply.

Learn more about common filters in customer journey reports.
- To configure your journey report further you can add multiple steps to a stage or make stages optional:
- To add multiple steps to a stage, click and drag a Step from the left panel, to a stage. This will create separate pathways within a stage, meaning that the contact or deal can complete either path to complete the stage. You can add up to five steps per stage.
-
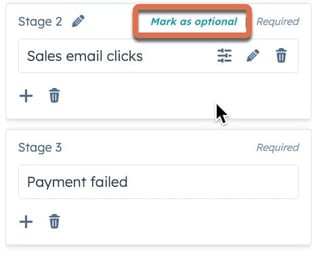
- To make a stage optional, hover over the step, and select Mark as optional. This will mean that a contact or deal does not have to go through that specific stage to continue along the journey. If a contact or deal makes it to the last stage, they will be included in the total conversion rate. The first and last stages cannot be made optional.
Please note: if you have multiple steps in a stage, the report will not show an aggregate number of contacts or deals in the stage. It will show the number that have completed each step.
Please note: you can analyze up to five years of data or up to twenty million unique events. If the report is configured with more than 20,000,001+ events, the date range window will be reduced to one month.
- Contacts or deals will only appear in the following stage if their events follow the stages' order chronologically.
- Journey reports count the unique number of contacts or deals that completed an event in the journey’s pattern, not the total number of unique events.
- The Include anonymous visitors option can only be applied for certain steps. This means that, depending on the steps selected in your journey report, some steps will include anonymized visitors and some will not.
- The Call ended and Call started touchpoints include calls made in HubSpot only and not from connected integrations.
- When creating a static list from journey analytics, a maximum of 100,000 objects can be included in the list.
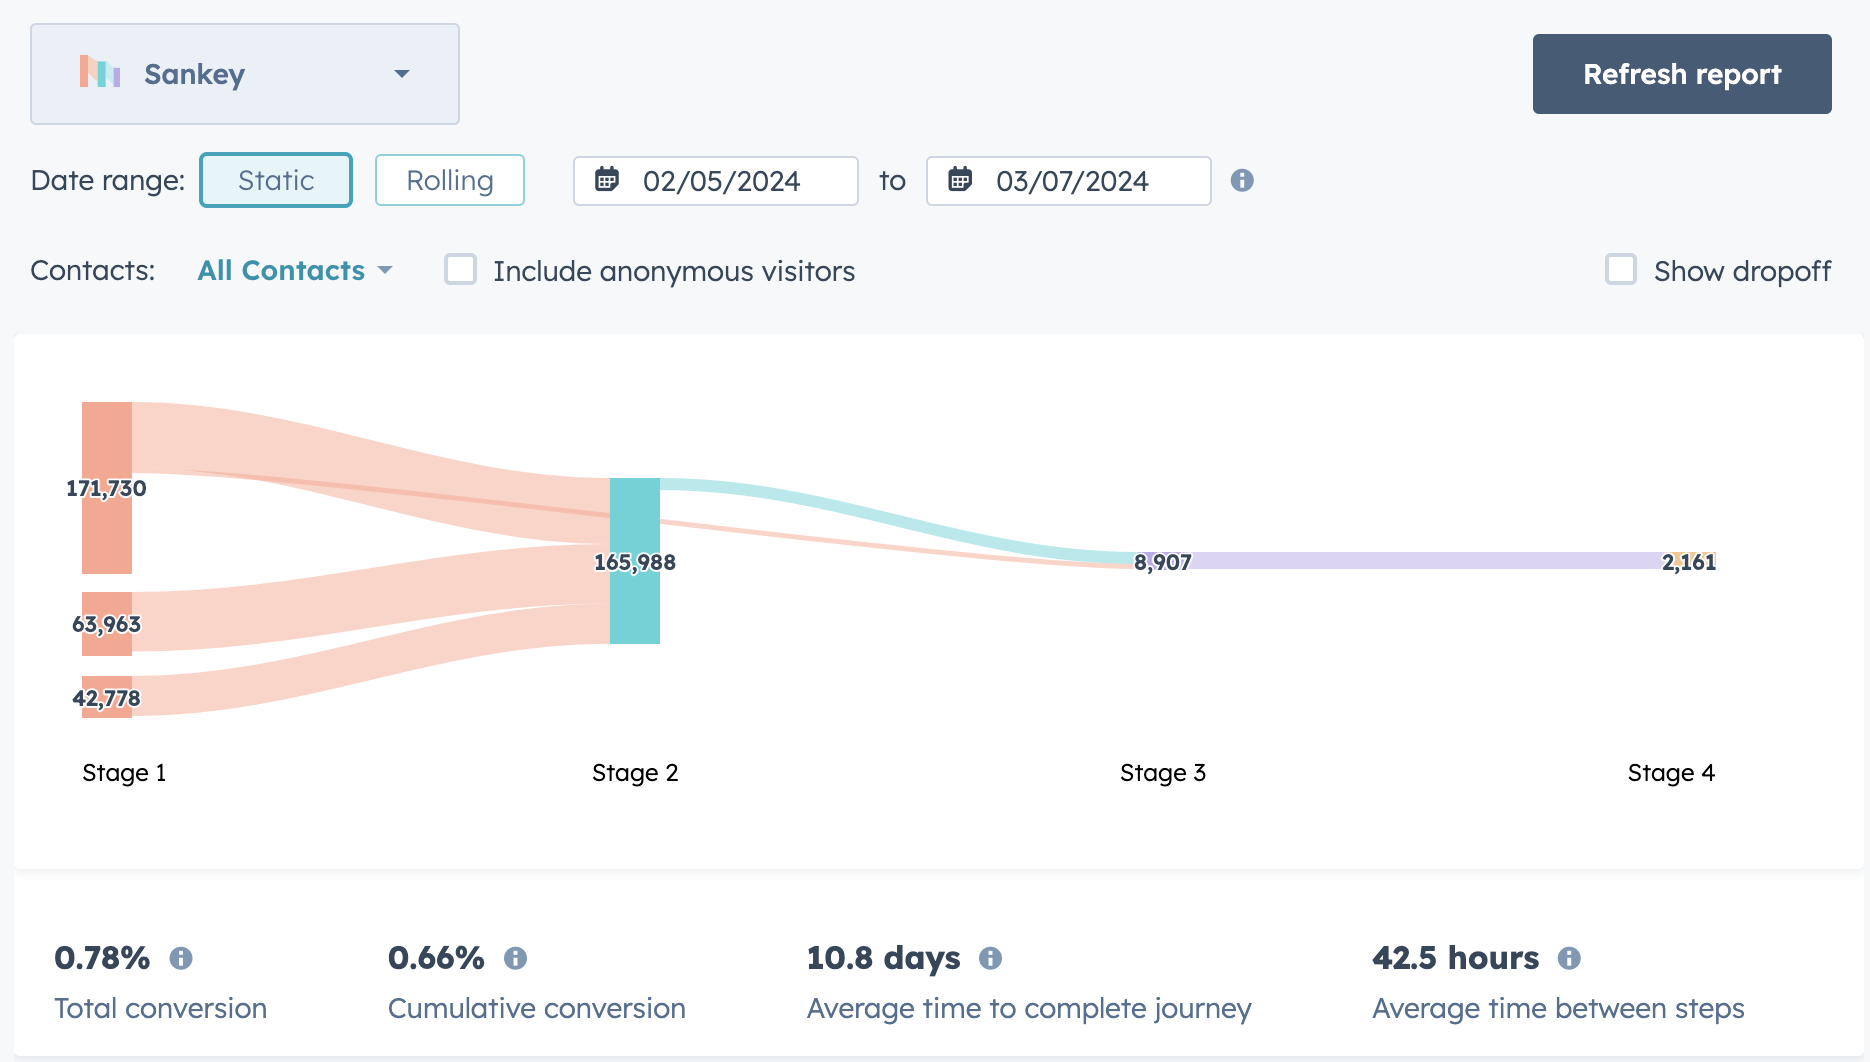
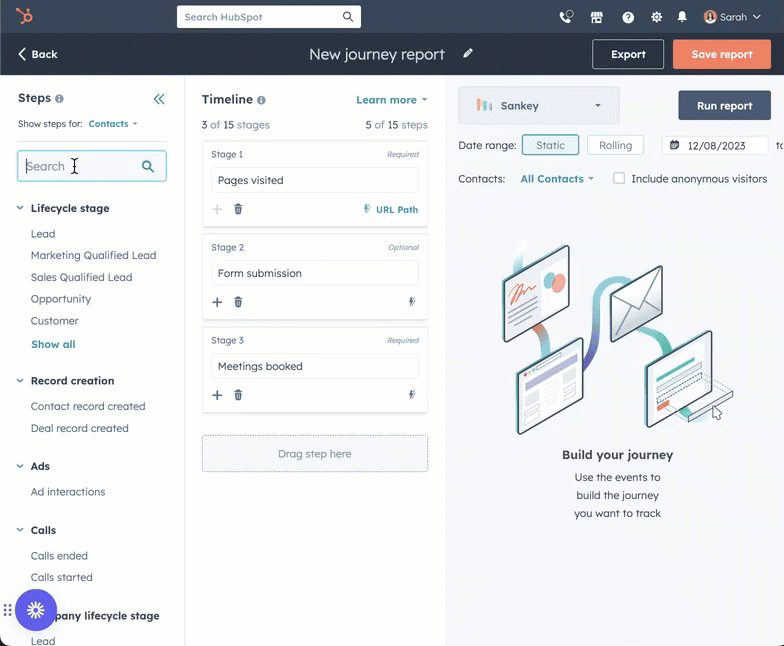
Example journey report
Below, find an example of how you can use journey reports to find what pages are driving new meetings and resulting in new deals being created for your business.
- In your HubSpot account, navigate to Reporting & Data > Reports.
- In the upper right, click Create report.
- In the Create reports from scratch section, select Customer Journey Reports.
- Select Contacts as the data source.
- In the right panel, select the checkbox to Include anonymous visitors.
- For the first stage, click and drag the step Pages visited to the center panel.
- Click the Break down by property icon and select URL path. This will show where visitors are going on your website. Click Apply.
- For the second stage, click and drag the step Form submission to the center panel. This will let you know if and where visitors are submitting forms on your website.
- For the third stage, click and drag the step Meetings booked to the center panel. Make the second stage optional. This will show how many meetings are booked from visiting your website or from submitting a form on your website.
- For the final stage, click and drag the step Deal record created to the center panel. This will show how many of the meetings resulted in a deal being created.
- In the top right, click Run report.
- In the below report, you can view conversion rate, cumulative conversion, average time to complete the journey, and the average time between steps.