

From 2009 to 2019, the US population has swelled by more than 20 million to nearly 330 million. Over that same period, the number of households with a television set (as measured by Nielsen) has declined – dropping four million households to 110 million.
We compared Nielsen Rankings to population growth over the last decade for all 210 Designated Market Areas (DMAs, which you can think of as regions that have the same local TV channels), and found big differences across the country as to how Americans are watching TV and how the apparent impact of cord-cutting is not uniform by state or region.
2009 vs. 2019: Summary
- The DMAs with the largest drop in TV homes are in northern cities, with Los Angeles, Chicago and New York losing 950,000 TV homes while gaining 1.5 million people.
- The DMAs with the largest gains in TV homes are in southern cities, predominantly Texas and Florida, with the curious exception of Washington, D.C.
- El Paso (Las Cruces) is the only DMA where TV homes grew faster than population growth.
Texans and Floridians watching TV more than anyone else in the U.S.
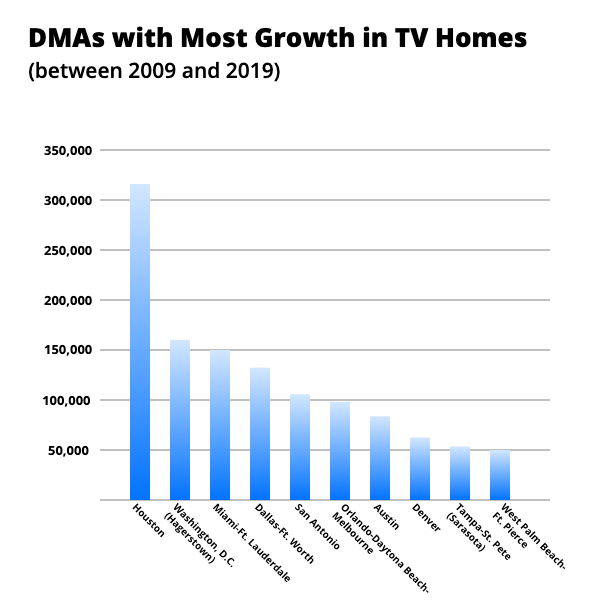
Between 2009 and 2019, DMAs in Florida and Texas saw the most growth in TV homes than any other DMAs in the country. For Dallas-Ft. Worth, Houston and Orlando-Daytona Beach-Melbourne, that growth make sense – those DMAs also rank in the top 10 for population growth amongst DMAs. What doesn’t make sense is that the number of TV homes shrunk an average of three percent in each of the DMAs with the most growth in TV homes. That’s one percent shy of the total shrinkage in TV homes across the nation.
Nielsen’s Highest Ranking DMAs are Cutting Ties with TV
Just as Los Angeles, New York and Chicago are the highest ranking DMAs for 2009 - 2019, they’re also the top three DMAs to lose the most TV homes.
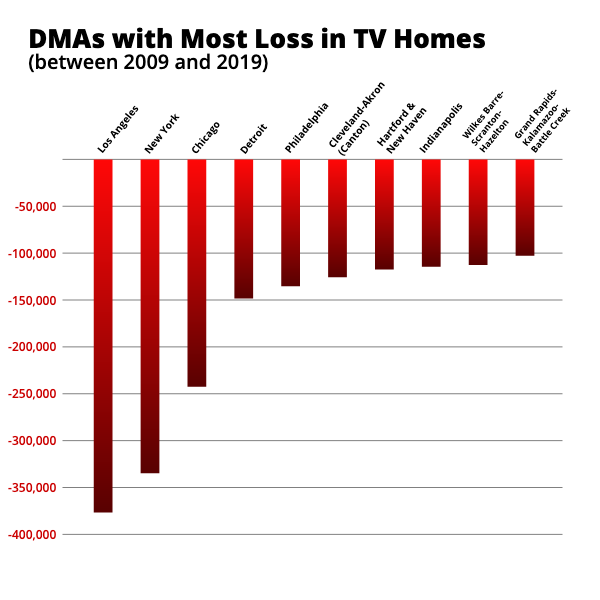
TV homes shrunk approximately three percent for Nielsen’s top three DMAs despite the growth in their overall populations. The Grand Rapids-Kalamazoo-Battle Creek and Wilkes Barre-Scranton-Hazelton DMAs took the hardest hit, losing seven percent of their TV homes. In Wilkes Barre-Scranton-Hazelton, the shrinkage is consequential of the loss in its overall population. The same applies for the Cleveland-Akron (Canton) and Hartford and New Haven DMAs.
Big City Newcomers Don’t Always Watch TV
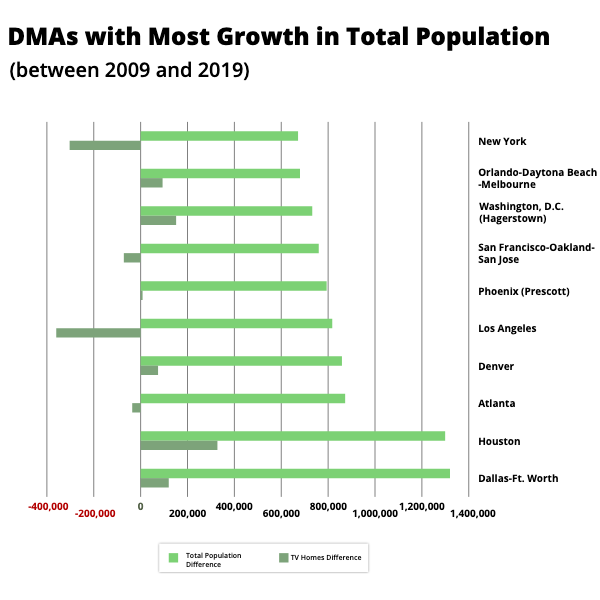
Some of the best movies and TV shows are based and/or filmed in New York and Los Angeles, but that doesn’t mean their residents are watching when they air. Nearly half of their new residents over the last decade do not have a TV in their home. Cities in these DMAs also rank in the top 10 cities with the highest cost of living so paying for entertainment may not be a priority for its residents.
On the other hand, newcomers in DMAs like Dallas-Ft. Worth and Houston still cherish their TV shows and are, in fact, living in the highest ranking DMAs in terms of overall population growth. Atlanta, which has become a hotspot for entertainment, and Denver took the third and fourth spot respectively with Phoenix, Washington, D.C. (Hagerstown), San Francisco-Oakland-San Jose and Orlando-Daytona Beach-Melbourne filling in the rest.
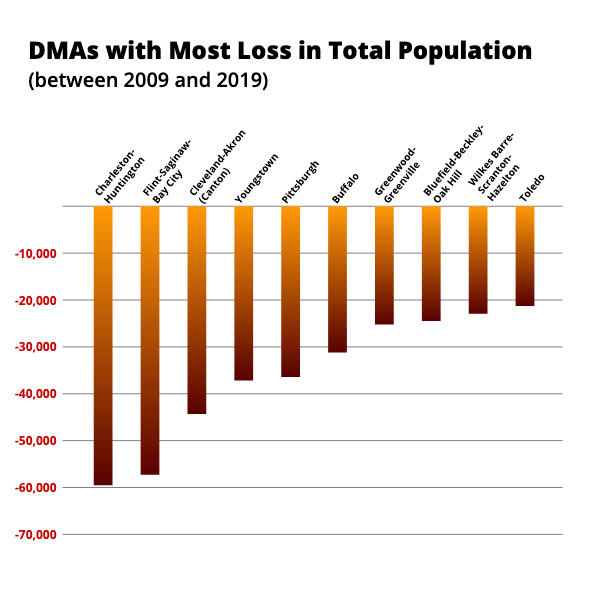
Then again, less popular big cities like Pittsburgh, Buffalo and Toledo have smaller populations now than they did in 2009. The Flint-Saginaw-Bay City DMA earned second place in the top 10 DMAs whose populations shrunk.
Looking Ahead to the Next Decade
The next decade could see the same or an even greater loss in TV homes despite the growth in TV viewing options. The total U.S. population grew over 23 million between 2009 and 2019 but there’s nearly 4.5 million less homes with a TV. That’s an average seven percent growth in overall population yet a four percent decline in homes with a TV.
Nielsen’s top 20 DMAs are the same, minus a few rank changes, and more than half of them lost between 6,000 and 170,000 households that watch TV. It is often said that having too many choices leads to no choice being made at all. Could the influx of viewing options be the reason why TV homes have declined?
| 2019 Rank | 2009 Rank | DESIGNATED MARKET AREA (DMA) | 2009 TV HOMES | 2019 TV HOMES | TV Homes Difference | 2008 Population | 2018 population | Population Difference | Population Growth | Growth in TV Homes | Pop. Growth - TV Growth |
|---|---|---|---|---|---|---|---|---|---|---|---|
| 1 | 1 | New York | 7,433,820 | 7,100,300 | -333,520 | 20,612,840 | 21,283,176 | 670,336 | 3.3% | -4.5% | 7.7% |
| 2 | 2 | Los Angeles | 5,654,260 | 5,276,600 | -377,660 | 15,521,146 | 16,332,043 | 810,897 | 5.2% | -6.7% | 11.9% |
| 3 | 3 | Chicago | 3,492,850 | 3,251,370 | -241,480 | 9,558,015 | 9,658,887 | 100,872 | 1.1% | -6.9% | 8.0% |
| 4 | 4 | Philadelphia | 2,950,220 | 2,816,850 | -133,370 | 7,902,607 | 8,143,927 | 241,320 | 3.1% | -4.5% | 7.6% |
| 5 | 5 | Dallas-Ft. Worth | 2,489,970 | 2,622,070 | 132,100 | 6,807,973 | 8,162,188 | 1,354,215 | 19.9% | 5.3% | 14.6% |
| 6 | 9 | Washington, DC (Hagrstwn) | 2,321,610 | 2,482,480 | 160,870 | 5,754,757 | 6,490,314 | 735,557 | 12.8% | 6.9% | 5.9% |
| 6 | 6 | San Francisco-Oak-San Jose | 2,476,450 | 2,414,470 | -61,980 | 7,152,912 | 7,905,011 | 752,099 | 10.5% | -2.5% | 13.0% |
| 7 | 10 | Houston | 2,106,210 | 2,423,360 | 317,150 | 6,006,435 | 7,347,905 | 1,341,470 | 22.3% | 15.1% | 7.3% |
| 7 | 7 | Boston (Manchester) | 2,409,080 | 2,364,870 | -44,210 | 6,246,200 | 6,694,971 | 448,771 | 7.2% | -1.8% | 9.0% |
| 8 | 8 | Atlanta | 2,369,780 | 2,341,390 | -28,390 | 6,185,820 | 7,052,143 | 866,323 | 14.0% | -1.2% | 15.2% |
| 11 | 13 | Tampa-St. Pete (Sarasota) | 1,822,160 | 1,875,420 | 53,260 | 4,307,019 | 4,952,843 | 645,824 | 15.0% | 2.9% | 12.1% |
| 12 | 12 | Phoenix (Prescott) | 1,855,930 | 1,864,420 | 8,490 | 4,876,332 | 5,675,346 | 799,014 | 16.4% | 0.5% | 15.9% |
| 13 | 14 | Seattle-Tacoma | 1,819,970 | 1,854,810 | 34,840 | 3,171,130 | 3,692,257 | 521,127 | 16.4% | 1.9% | 14.5% |
| 14 | 11 | Detroit | 1,926,970 | 1,777,240 | -149,730 | 4,878,082 | 4,889,026 | 10,944 | 0.2% | -7.8% | 8.0% |
| 15 | 15 | Minneapolis-St. Paul | 1,730,530 | 1,713,310 | -17,220 | 4,445,674 | 4,792,810 | 347,136 | 7.8% | -1.0% | 8.8% |
| 16 | 16 | Miami-Ft. Lauderdale | 1,546,920 | 1,697,840 | 150,920 | 4,232,425 | 4,787,868 | 555,443 | 13.1% | 9.8% | 3.4% |
| 17 | 18 | Denver | 1,524,210 | 1,585,270 | 61,060 | 4,500,756 | 5,348,199 | 847,443 | 18.8% | 4.0% | 14.8% |
| 18 | 19 | Orlando-Daytona Bch-Melbrn | 1,466,420 | 1,565,890 | 99,470 | 3,637,264 | 4,318,147 | 680,883 | 18.7% | 6.8% | 11.9% |
| 19 | 17 | Cleveland-Akron (Canton) | 1,524,930 | 1,399,470 | -125,460 | 3,862,970 | 3,818,000 | -44,970 | -1.2% | -8.2% | 7.1% |
| 20 | 20 | Sacramnto-Stkton-Modesto | 1,399,520 | 1,357,690 | -41,830 | 3,738,559 | 4,105,171 | 366,612 | 9.8% | -3.0% | 12.8% |
| 21 | 21 | St. Louis | 1,249,820 | 1,164,400 | -85,420 | 3,099,102 | 3,129,113 | 30,011 | 1.0% | -6.8% | 7.8% |
| 22 | 22 | Portland, OR | 1,175,100 | 1,141,770 | -33,330 | 2,844,837 | 3,211,180 | 366,343 | 12.9% | -2.8% | 15.7% |
| 23 | 24 | Charlotte | 1,122,860 | 1,129,900 | 7,040 | 2,889,174 | 3,313,426 | 424,252 | 14.7% | 0.6% | 14.1% |
| 24 | 23 | Pittsburgh | 1,156,460 | 1,108,780 | -47,680 | 2,827,640 | 2,791,401 | -36,239 | -1.3% | -4.1% | 2.8% |
| 25 | 27 | Raleigh-Durham (Fayetvlle) | 1,080,680 | 1,108,710 | 28,030 | 2,822,168 | 3,259,148 | 436,980 | 15.5% | 2.6% | 12.9% |
| 26 | 26 | Baltimore | 1,102,080 | 1,084,180 | -17,900 | 2,902,957 | 3,027,268 | 124,311 | 4.3% | -1.6% | 5.9% |
| 27 | 29 | Nashville | 1,016,290 | 1,021,780 | 5,490 | 2,544,366 | 2,923,123 | 378,757 | 14.9% | 0.5% | 14.3% |
| 28 | 25 | Indianapolis | 1,114,970 | 999,790 | -115,180 | 2,790,931 | 2,988,026 | 197,095 | 7.1% | -10.3% | 17.4% |
| 29 | 28 | San Diego | 1,066,680 | 987,760 | -78,920 | 3,022,116 | 3,343,364 | 321,248 | 10.6% | -7.4% | 18.0% |
| 30 | 33 | Salt Lake City | 919,390 | 935,810 | 16,420 | 2,815,638 | 3,332,512 | 516,874 | 18.4% | 1.8% | 16.6% |
| 31 | 37 | San Antonio | 818,560 | 923,990 | 105,430 | 2,395,985 | 2,875,701 | 479,716 | 20.0% | 12.9% | 7.1% |
| 32 | 31 | Kansas City | 937,970 | 909,420 | -28,550 | 2,343,895 | 2,524,865 | 180,970 | 7.7% | -3.0% | 10.8% |
| 33 | 30 | Hartford & New Haven | 1,014,990 | 897,870 | -117,120 | 2,641,755 | 2,628,842 | -12,913 | -0.5% | -11.5% | 11.1% |
| 34 | 32 | Columbus, OH | 925,840 | 889,600 | -36,240 | 2,256,717 | 2,491,617 | 234,900 | 10.4% | -3.9% | 14.3% |
| 35 | 34 | Cincinnati | 915,570 | 850,030 | -65,540 | 2,303,140 | 2,395,189 | 92,049 | 4.0% | -7.2% | 11.2% |
| 36 | 35 | Milwaukee | 905,350 | 848,420 | -56,930 | 2,287,545 | 2,334,137 | 46,592 | 2.0% | -6.3% | 8.3% |
| 37 | 38 | West Palm Beach-Ft. Pierce | 779,430 | 829,880 | 50,450 | 1,888,703 | 2,166,931 | 278,228 | 14.7% | 6.5% | 8.3% |
| 38 | 36 | Greenvll-Spart-Ashevll-And | 858,050 | 805,920 | -52,130 | 2,145,392 | 2,333,923 | 188,531 | 8.8% | -6.1% | 14.9% |
| 39 | 42 | Las Vegas | 728,410 | 766,500 | 38,090 | 1,961,822 | 2,282,194 | 320,372 | 16.3% | 5.2% | 11.1% |
| 40 | 49 | Austin | 667,670 | 751,650 | 83,980 | 1,750,215 | 2,295,979 | 545,764 | 31.2% | 12.6% | 18.6% |
| 41 | 41 | Harrisburg-Lncstr-Leb-York | 738,880 | 705,190 | -33,690 | 1,787,296 | 1,881,540 | 94,244 | 5.3% | -4.6% | 9.8% |
| 42 | 47 | Jacksonville | 674,860 | 681,330 | 6,470 | 1,721,922 | 1,947,869 | 225,947 | 13.1% | 1.0% | 12.2% |
| 43 | 40 | Birmingham (Ann and Tusc) | 739,750 | 679,550 | -60,200 | 1,848,204 | 1,892,820 | 44,616 | 2.4% | -8.1% | 10.6% |
| 44 | 43 | Norfolk-Portsmth-Newpt Nws | 718,020 | 678,210 | -39,810 | 1,879,894 | 1,942,913 | 63,019 | 3.4% | -5.5% | 8.9% |
| 45 | 45 | Oklahoma City | 687,300 | 676,720 | -10,580 | 1,753,916 | 1,943,710 | 189,794 | 10.8% | -1.5% | 12.4% |
| 46 | 46 | Greensboro-H.Point-W.Salem | 685,110 | 675,130 | -9,980 | 1,731,390 | 1,840,542 | 109,152 | 6.3% | -1.5% | 7.8% |
| 47 | 44 | Albuquerque-Santa Fe | 689,120 | 650,890 | -38,230 | 1,880,791 | 1,955,469 | 74,678 | 4.0% | -5.5% | 9.5% |
| 48 | 50 | Louisville | 667,230 | 647,190 | -20,040 | 1,659,035 | 1,756,039 | 97,004 | 5.8% | -3.0% | 8.9% |
| 49 | 39 | Grand Rapids-Kalmzoo-B.Crk | 741,420 | 639,410 | -102,010 | 1,980,502 | 2,079,517 | 99,015 | 5.0% | -13.8% | 18.8% |
| 50 | 53 | New Orleans | 602,740 | 624,020 | 21,280 | 1,607,810 | 1,762,615 | 154,805 | 9.6% | 3.5% | 6.1% |
| 51 | 48 | Memphis | 673,770 | 623,390 | -50,380 | 1,874,231 | 1,890,985 | 16,754 | 0.9% | -7.5% | 8.4% |
| 52 | 51 | Buffalo | 631,120 | 586,930 | -44,190 | 1,608,281 | 1,577,159 | -31,122 | -1.9% | -7.0% | 5.1% |
| 53 | 52 | Providence-New Bedford | 622,580 | 580,120 | -42,460 | 1,601,459 | 1,621,337 | 19,878 | 1.2% | -6.8% | 8.1% |
| 54 | 55 | Fresno-Visalia | 574,900 | 568,920 | -5,980 | 1,908,249 | 2,061,535 | 153,286 | 8.0% | -1.0% | 9.1% |
| 55 | 62 | Ft. Myers-Naples | 509,530 | 554,430 | 44,900 | 1,174,395 | 1,410,865 | 236,470 | 20.1% | 8.8% | 11.3% |
| 56 | 58 | Richmond-Petersburg | 550,240 | 551,850 | 1,610 | 1,468,088 | 1,591,156 | 123,068 | 8.4% | 0.3% | 8.1% |
| 57 | 56 | Little Rock-Pine Bluff | 567,060 | 527,090 | -39,970 | 1,424,523 | 1,469,583 | 45,060 | 3.2% | -7.0% | 10.2% |
| 58 | 60 | Mobile-Pensacola (Ft Walt) | 537,810 | 524,390 | -13,420 | 1,344,949 | 1,457,907 | 112,958 | 8.4% | -2.5% | 10.9% |
| 59 | 57 | Albany-Schenectady-Troy | 556,750 | 520,540 | -36,210 | 1,387,070 | 1,385,497 | -1,573 | -0.1% | -6.5% | 6.4% |
| 60 | 59 | Knoxville | 547,930 | 512,160 | -35,770 | 1,318,891 | 1,390,533 | 71,642 | 5.4% | -6.5% | 12.0% |
| 61 | 61 | Tulsa | 529,540 | 508,550 | -20,990 | 1,353,850 | 1,427,241 | 73,391 | 5.4% | -4.0% | 9.4% |
| 62 | 54 | Wilkes Barre-Scranton-Hztn | 594,570 | 481,390 | -113,180 | 1,525,936 | 1,502,507 | -23,429 | -1.5% | -19.0% | 17.5% |
| 63 | 63 | Lexington | 503,260 | 464,340 | -38,920 | 1,227,489 | 1,298,540 | 71,051 | 5.8% | -7.7% | 13.5% |
| 64 | 64 | Dayton | 483,790 | 463,430 | -20,360 | 1,327,324 | 1,318,891 | -8,433 | -0.6% | -4.2% | 3.6% |
| 65 | 66 | Flint-Saginaw-Bay City | 465,790 | 430,660 | -35,130 | 1,191,544 | 1,134,270 | -57,274 | -4.8% | -7.5% | 2.7% |
| 66 | 72 | Honolulu | 429,940 | 425,800 | -4,140 | 1,332,213 | 1,420,491 | 88,278 | 6.6% | -1.0% | 7.6% |
| 67 | 70 | Green Bay-Appleton | 444,210 | 421,480 | -22,730 | 1,109,522 | 1,143,065 | 33,543 | 3.0% | -5.1% | 8.1% |
| 68 | 67 | Roanoke-Lynchburg | 461,420 | 417,200 | -44,220 | 1,105,945 | 1,124,169 | 18,224 | 1.6% | -9.6% | 11.2% |
| 69 | 76 | Omaha | 411,520 | 405,260 | -6,260 | 1,074,647 | 1,168,092 | 93,445 | 8.7% | -1.5% | 10.2% |
| 70 | 65 | Charleston-Huntington | 479,750 | 402,140 | -77,610 | 1,244,330 | 1,185,209 | -59,121 | -4.8% | -16.2% | 11.4% |
| 71 | 73 | Toledo | 425,890 | 401,510 | -24,380 | 1,111,218 | 1,089,612 | -21,606 | -1.9% | -5.7% | 3.8% |
| 72 | 74 | Springfield, MO | 421,960 | 395,870 | -26,090 | 1,103,165 | 1,151,718 | 48,553 | 4.4% | -6.2% | 10.6% |
| 73 | 68 | Tucson (Sierra Vista) | 456,030 | 392,920 | -63,110 | 1,142,945 | 1,212,354 | 69,409 | 6.1% | -13.8% | 19.9% |
| 74 | 79 | Columbia, SC | 393,170 | 389,590 | -3,580 | 1,017,350 | 1,094,930 | 77,580 | 7.6% | -0.9% | 8.5% |
| 75 | 71 | Des Moines-Ames | 432,410 | 383,590 | -48,820 | 1,084,897 | 1,184,348 | 99,451 | 9.2% | -11.3% | 20.5% |
| 76 | 69 | Wichita-Hutchinson Plus | 450,930 | 382,780 | -68,150 | 1,181,284 | 1,196,430 | 15,146 | 1.3% | -15.1% | 16.4% |
| 77 | 75 | Spokane | 416,630 | 382,690 | -33,940 | 4,048,353 | 4,623,888 | 575,535 | 14.2% | -8.1% | 22.4% |
| 78 | 87 | Harlingen-Wslco-Brnsvl-McA | 349,910 | 375,600 | 25,690 | 1,211,220 | 1,375,887 | 164,667 | 13.6% | 7.3% | 6.3% |
| 79 | 82 | Huntsville-Decatur (Flor) | 386,520 | 372,770 | -13,750 | 997,189 | 1,063,156 | 65,967 | 6.6% | -3.6% | 10.2% |
| 80 | 80 | Rochester, NY | 390,590 | 352,070 | -38,520 | 1,032,048 | 1,030,470 | -1,578 | -0.2% | -9.9% | 9.7% |
| 81 | 81 | Syracuse | 388,000 | 350,730 | -37,270 | 924,685 | 912,563 | -12,122 | -1.3% | -9.6% | 8.3% |
| 82 | 83 | Champaign&Sprngfld-Decatur | 386,000 | 344,500 | -41,500 | 932,820 | 919,570 | -13,250 | -1.4% | -10.8% | 9.3% |
| 83 | 86 | Chattanooga | 366,780 | 341,190 | -25,590 | 946,691 | 1,009,484 | 62,793 | 6.6% | -7.0% | 13.6% |
| 84 | 77 | Portland-Auburn | 410,890 | 339,980 | -70,910 | 989,906 | 1,007,178 | 17,272 | 1.7% | -17.3% | 19.0% |
| 85 | 98 | El Paso (Las Cruces) | 308,080 | 338,770 | 30,690 | 976,649 | 1,065,279 | 88,630 | 9.1% | 10.0% | -0.9% |
| 86 | 85 | Madison | 378,740 | 338,240 | -40,500 | 944,447 | 1,015,447 | 71,000 | 7.5% | -10.7% | 18.2% |
| 87 | 88 | Cedar Rapids-Wtrlo-IWC&Dub | 346,330 | 330,340 | -15,990 | 866,794 | 909,954 | 43,160 | 5.0% | -4.6% | 9.6% |
| 88 | 78 | Paducah-Cape Girard-Harsbg | 393,260 | 324,020 | -69,240 | 980,357 | 960,022 | -20,335 | -2.1% | -17.6% | 15.5% |
| 89 | 94 | Waco-Temple-Bryan | 329,690 | 322,820 | -6,870 | 946,773 | 1,077,369 | 130,596 | 13.8% | -2.1% | 15.9% |
| 90 | 84 | Shreveport | 385,770 | 322,610 | -63,160 | 1,046,861 | 1,046,980 | 119 | 0.0% | -16.4% | 16.4% |
| 91 | 91 | Colorado Springs-Pueblo | 334,390 | 319,930 | -14,460 | 885,115 | 1,012,897 | 127,782 | 14.4% | -4.3% | 18.8% |
| 92 | 90 | Jackson, MS | 334,650 | 306,770 | -27,880 | 909,075 | 910,333 | 1,258 | 0.1% | -8.3% | 8.5% |
| 93 | 96 | Savannah | 319,160 | 303,390 | -15,770 | 863,399 | 970,157 | 106,758 | 12.4% | -4.9% | 17.3% |
| 94 | 99 | Charleston, SC | 307,610 | 302,330 | -5,280 | 778,338 | 918,158 | 139,820 | 18.0% | -1.7% | 19.7% |
| 95 | 104 | Myrtle Beach-Florence | 285,010 | 302,040 | 17,030 | 726,999 | 803,785 | 76,786 | 10.6% | 6.0% | 4.6% |
| 96 | 93 | Burlington-Plattsburgh | 331,320 | 294,260 | -37,060 | 848,831 | 849,130 | 299 | 0.0% | -11.2% | 11.2% |
| 97 | 95 | Baton Rouge | 326,390 | 287,430 | -38,960 | 889,038 | 924,502 | 35,464 | 4.0% | -11.9% | 15.9% |
| 98 | 97 | Davenport-R.Island-Moline | 309,600 | 280,420 | -29,180 | 770,755 | 758,854 | -11,901 | -1.5% | -9.4% | 7.9% |
| 99 | 89 | South Bend-Elkhart | 334,720 | 274,380 | -60,340 | 894,087 | 902,543 | 8,456 | 0.9% | -18.0% | 19.0% |
| 100 | 112 | Boise | 262,290 | 273,500 | 11,210 | 566,395 | 654,792 | 88,397 | 15.6% | 4.3% | 11.3% |
| 101 | 100 | Ft. Smith-Fay-Sprngdl-Rgrs | 297,920 | 272,240 | -25,680 | 752,126 | 858,234 | 106,108 | 14.1% | -8.6% | 22.7% |
| 102 | 92 | Tri-Cities, TN-VA | 332,840 | 266,110 | -66,730 | 799,166 | 786,727 | -12,439 | -1.6% | -20.0% | 18.5% |
| 103 | 102 | Evansville | 292,220 | 265,790 | -26,430 | 732,862 | 737,125 | 4,263 | 0.6% | -9.0% | 9.6% |
| 104 | 107 | Ft. Wayne | 275,350 | 265,420 | -9,930 | 710,619 | 733,936 | 23,317 | 3.3% | -3.6% | 6.9% |
| 105 | 115 | Augusta-Aiken | 253,950 | 264,350 | 10,400 | 701,110 | 744,866 | 43,756 | 6.2% | 4.1% | 2.1% |
| 106 | 101 | Johnstown-Altoona-St Colge | 293,860 | 262,840 | -31,020 | 880,302 | 867,450 | -12,852 | -1.5% | -10.6% | 9.1% |
| 107 | 103 | Greenville-N.Bern-Washngtn | 289,050 | 261,830 | -27,220 | 772,043 | 818,180 | 46,137 | 6.0% | -9.4% | 15.4% |
| 108 | 111 | Springfield-Holyoke | 262,850 | 251,660 | -11,190 | 691,239 | 702,724 | 11,485 | 1.7% | -4.3% | 5.9% |
| 109 | 108 | Reno | 271,080 | 246,190 | -24,890 | 278,915 | 281,833 | 2,918 | 1.0% | -9.2% | 10.2% |
| 110 | 114 | Lansing | 258,650 | 241,940 | -16,710 | 671,414 | 686,465 | 15,051 | 2.2% | -6.5% | 8.7% |
| 111 | 106 | Lincoln & Hastings-Krny | 281,290 | 240,660 | -40,630 | 696,477 | 749,393 | 52,916 | 7.6% | -14.4% | 22.0% |
| 112 | 105 | Tallahassee-Thomasville | 282,390 | 237,940 | -44,450 | 726,446 | 746,809 | 20,363 | 2.8% | -15.7% | 18.5% |
| 113 | 116 | Peoria-Bloomington | 248,510 | 234,050 | -14,460 | 640,053 | 631,111 | -8,942 | -1.4% | -5.8% | 4.4% |
| 114 | 110 | Tyler-Longview(Lfkn&Ncgd) | 265,200 | 232,180 | -33,020 | 710,595 | 757,069 | 46,474 | 6.5% | -12.5% | 19.0% |
| 115 | 113 | Sioux Falls(Mitchell) | 260,190 | 231,540 | -28,650 | 653,132 | 711,731 | 58,599 | 9.0% | -11.0% | 20.0% |
| 116 | 118 | Montgomery-Selma | 247,230 | 229,330 | -17,900 | 648,991 | 633,985 | -15,006 | -2.3% | -7.2% | 4.9% |
| 117 | 120 | Fargo | 241,120 | 228,740 | -12,380 | 601,149 | 647,152 | 46,003 | 7.7% | -5.1% | 12.8% |
| 118 | 122 | Macon | 239,820 | 224,180 | -15,640 | 654,160 | 662,966 | 8,806 | 1.3% | -6.5% | 7.9% |
| 119 | 126 | Yakima-Pasco-Rchlnd-Knnwck | 216,780 | 223,450 | 6,670 | 1,312,805 | 1,487,102 | 174,297 | 13.3% | 3.1% | 10.2% |
| 120 | 117 | Traverse City-Cadillac | 247,650 | 218,520 | -29,130 | 616,969 | 617,291 | 322 | 0.1% | -11.8% | 11.8% |
| 121 | 123 | Lafayette, LA | 230,670 | 216,420 | -14,250 | 609,351 | 637,153 | 27,802 | 4.6% | -6.2% | 10.7% |
| 122 | 125 | Bakersfield | 220,730 | 215,360 | -5,370 | 818,327 | 896,764 | 78,437 | 9.6% | -2.4% | 12.0% |
| 123 | 119 | Eugene | 242,790 | 215,070 | -27,720 | 602,868 | 646,384 | 43,516 | 7.2% | -11.4% | 18.6% |
| 124 | 121 | SantaBarbra-SanMar-SanLuOb | 240,190 | 213,510 | -26,680 | 682,217 | 730,537 | 48,320 | 7.1% | -11.1% | 18.2% |
| 125 | 109 | Youngstown | 268,930 | 213,380 | -55,550 | 679,421 | 641,617 | -37,804 | -5.6% | -20.7% | 15.1% |
| 126 | 124 | Monterey-Salinas | 225,350 | 206,300 | -19,050 | 716,809 | 771,386 | 54,577 | 7.6% | -8.5% | 16.1% |
| 127 | 128 | Columbus, GA (Opelika, AL) | 213,980 | 198,740 | -15,240 | 559,520 | 597,977 | 38,457 | 6.9% | -7.1% | 14.0% |
| 128 | 129 | Corpus Christi | 197,290 | 193,070 | -4,220 | 570,898 | 600,702 | 29,804 | 5.2% | -2.1% | 7.4% |
| 129 | 134 | Wilmington | 187,480 | 190,390 | 2,910 | 442,685 | 520,025 | 77,340 | 17.5% | 1.6% | 15.9% |
| 130 | 127 | La Crosse-Eau Claire | 215,610 | 186,870 | -28,740 | 544,535 | 561,330 | 16,795 | 3.1% | -13.3% | 16.4% |
| 131 | 131 | Amarillo | 192,090 | 175,880 | -16,210 | 529,491 | 549,508 | 20,017 | 3.8% | -8.4% | 12.2% |
| 132 | 130 | Chico-Redding | 197,280 | 171,220 | -26,060 | 500,604 | 515,794 | 15,190 | 3.0% | -13.2% | 16.2% |
| 133 | 133 | Columbus-Tupelo-W Pnt-Hstn | 188,740 | 168,210 | -20,530 | 491,631 | 492,038 | 407 | 0.1% | -10.9% | 11.0% |
| 134 | 135 | Wausau-Rhinelander | 184,220 | 157,180 | -27,040 | 450,514 | 446,938 | -3,576 | -0.8% | -14.7% | 13.9% |
| 135 | 140 | Medford-Klamath Falls | 171,830 | 156,520 | -15,310 | 434,880 | 457,803 | 22,923 | 5.3% | -8.9% | 14.2% |
| 136 | 137 | Columbia-Jefferson City | 179,010 | 156,430 | -22,580 | 459,797 | 482,949 | 23,152 | 5.0% | -12.6% | 17.6% |
| 137 | 136 | Monroe-El Dorado | 179,190 | 156,410 | -22,780 | 479,023 | 466,654 | -12,369 | -2.6% | -12.7% | 10.1% |
| 138 | 144 | Salisbury | 157,940 | 152,980 | -4,960 | 366,772 | 409,979 | 43,207 | 11.8% | -3.1% | 14.9% |
| 139 | 132 | Rockford | 188,860 | 152,800 | -36,060 | 487,816 | 467,557 | -20,259 | -4.2% | -19.1% | 14.9% |
| 140 | 141 | Beaumont-Port Arthur | 165,440 | 152,710 | -12,730 | 456,381 | 467,094 | 10,713 | 2.3% | -7.7% | 10.0% |
| 141 | 138 | Topeka | 175,940 | 151,860 | -24,080 | 456,457 | 461,949 | 5,492 | 1.2% | -13.7% | 14.9% |
| 142 | 156 | Odessa-Midland | 141,560 | 150,430 | 8,870 | 396,447 | 478,886 | 82,439 | 20.8% | 6.3% | 14.5% |
| 143 | 143 | Lubbock | 158,070 | 150,270 | -7,800 | 431,342 | 470,569 | 39,227 | 9.1% | -4.9% | 14.0% |
| 144 | 139 | Duluth-Superior | 173,180 | 148,870 | -24,310 | 455,952 | 452,081 | -3,871 | -0.8% | -14.0% | 13.2% |
| 145 | 142 | Palm Springs | 159,240 | 147,170 | -12,070 | 2,109,712 | 2,450,758 | 341,046 | 16.2% | -7.6% | 23.7% |
| 146 | 158 | Minot-Bsmrck-Dcknsn(Wlstn) | 136,730 | 145,200 | 8,470 | 410,418 | 461,924 | 51,506 | 12.5% | 6.2% | 6.4% |
| 147 | 150 | Anchorage | 150,620 | 142,000 | -8,620 | 555,155 | 578,050 | 22,895 | 4.1% | -5.7% | 9.8% |
| 148 | 145 | Wichita Falls & Lawton | 157,820 | 139,590 | -18,230 | 405,954 | 404,203 | -1,751 | -0.4% | -11.6% | 11.1% |
| 149 | 149 | Sioux City | 154,900 | 135,660 | -19,240 | 407,721 | 407,772 | 51 | 0.0% | -12.4% | 12.4% |
| 150 | 151 | Panama City | 147,520 | 135,550 | -11,970 | 364,958 | 400,268 | 35,310 | 9.7% | -8.1% | 17.8% |
| 151 | 146 | Erie | 157,610 | 133,260 | -24,350 | 409,562 | 396,622 | -12,940 | -3.2% | -15.4% | 12.3% |
| 152 | 147 | Albany, GA | 156,800 | 130,950 | -25,850 | 418,384 | 412,218 | -6,166 | -1.5% | -16.5% | 15.0% |
| 153 | 148 | Joplin-Pittsburg | 156,560 | 129,600 | -26,960 | 401,583 | 399,375 | -2,208 | -0.5% | -17.2% | 16.7% |
| 154 | 154 | Rochestr-Mason City-Austin | 144,700 | 128,700 | -16,000 | 363,499 | 375,459 | 11,960 | 3.3% | -11.1% | 14.3% |
| 155 | 153 | Bangor | 145,100 | 124,190 | -20,910 | 349,562 | 344,483 | -5,079 | -1.5% | -14.4% | 13.0% |
| 156 | 163 | Biloxi-Gulfport | 121,750 | 122,100 | 350 | 359,803 | 392,894 | 33,091 | 9.2% | 0.3% | 8.9% |
| 157 | 160 | Gainesville | 129,960 | 120,580 | -9,380 | 318,708 | 345,682 | 26,974 | 8.5% | -7.2% | 15.7% |
| 158 | 152 | Terre Haute | 145,450 | 120,350 | -25,100 | 414,166 | 405,072 | -9,094 | -2.2% | -17.3% | 15.1% |
| 159 | 161 | Sherman-Ada | 128,100 | 118,390 | -9,710 | 325,999 | 350,701 | 24,702 | 7.6% | -7.6% | 15.2% |
| 160 | 157 | Binghamton | 138,930 | 115,960 | -22,970 | 352,216 | 332,282 | -19,934 | -5.7% | -16.5% | 10.9% |
| 161 | 162 | Idaho Fals-Pocatllo(Jcksn) | 124,220 | 115,750 | -8,470 | 627,497 | 709,668 | 82,171 | 13.1% | -6.8% | 19.9% |
| 162 | 159 | Wheeling-Steubenville | 133,700 | 113,690 | -20,010 | 384,729 | 363,465 | -21,264 | -5.5% | -15.0% | 9.4% |
| 163 | 155 | Bluefield-Beckley-Oak Hill | 142,570 | 109,900 | -32,670 | 347,566 | 323,386 | -24,180 | -7.0% | -22.9% | 16.0% |
| 164 | 166 | Missoula | 111,340 | 109,440 | -1,900 | 285,386 | 313,857 | 28,471 | 10.0% | -1.7% | 11.7% |
| 165 | 165 | Abilene-Sweetwater | 115,310 | 104,440 | -10,870 | 303,579 | 309,790 | 6,211 | 2.0% | -9.4% | 11.5% |
| 166 | 164 | Yuma-El Centro | 115,650 | 101,040 | -14,610 | 359,119 | 393,955 | 34,836 | 9.7% | -12.6% | 22.3% |
| 167 | 170 | Billings | 106,030 | 100,330 | -5,700 | 284,393 | 310,103 | 25,710 | 9.0% | -5.4% | 14.4% |
| 168 | 167 | Hattiesburg-Laurel | 110,330 | 99,680 | -10,650 | 291,555 | 298,169 | 6,614 | 2.3% | -9.7% | 11.9% |
| 169 | 169 | Utica | 106,280 | 91,520 | -14,760 | 361,447 | 351,159 | -10,288 | -2.8% | -13.9% | 11.0% |
| 170 | 168 | Clarksburg-Weston | 109,150 | 90,960 | -18,190 | 270,580 | 267,703 | -2,877 | -1.1% | -16.7% | 15.6% |
| 171 | 174 | Rapid City | 96,450 | 90,940 | -5,510 | 243,508 | 250,417 | 6,909 | 2.8% | -5.7% | 8.6% |
| 172 | 176 | Lake Charles | 95,410 | 90,570 | -4,840 | 257,109 | 272,938 | 15,829 | 6.2% | -5.1% | 11.2% |
| 173 | 172 | Dothan | 100,950 | 90,420 | -10,530 | 261,434 | 267,672 | 6,238 | 2.4% | -10.4% | 12.8% |
| 174 | 171 | Quincy-Hannibal-Keokuk | 103,910 | 88,510 | -15,400 | 285,200 | 272,933 | -12,267 | -4.3% | -14.8% | 10.5% |
| 175 | 178 | Harrisonburg | 92,900 | 84,950 | -7,950 | 328,118 | 345,295 | 17,177 | 5.2% | -8.6% | 13.8% |
| 176 | 175 | Elmira (Corning) | 96,090 | 83,190 | -12,900 | 247,482 | 238,725 | -8,757 | -3.5% | -13.4% | 9.9% |
| 177 | 173 | Jackson, TN | 98,050 | 83,010 | -15,040 | 179,423 | 179,248 | -175 | -0.1% | -15.3% | 15.2% |
| 178 | 177 | Watertown | 94,960 | 79,690 | -15,270 | 253,595 | 246,249 | -7,346 | -2.9% | -16.1% | 13.2% |
| 179 | 179 | Alexandria, LA | 89,630 | 79,250 | -10,380 | 242,489 | 242,366 | -123 | -0.1% | -11.6% | 11.5% |
| 180 | 181 | Jonesboro | 80,900 | 75,220 | -5,680 | 217,440 | 234,071 | 16,631 | 7.6% | -7.0% | 14.7% |
| 181 | 182 | Bowling Green | 80,260 | 74,500 | -5,760 | 230,416 | 255,296 | 24,880 | 10.8% | -7.2% | 18.0% |
| 182 | 180 | Marquette | 89,290 | 74,070 | -15,220 | 219,488 | 212,806 | -6,682 | -3.0% | -17.0% | 14.0% |
| 183 | 183 | Charlottesville | 76,600 | 71,370 | -5,230 | 170,674 | 189,909 | 19,235 | 11.3% | -6.8% | 18.1% |
| 184 | 188 | Laredo | 68,110 | 70,220 | 2,110 | 253,927 | 290,100 | 36,173 | 14.2% | 3.1% | 11.1% |
| 185 | 190 | Butte-Bozeman | 65,480 | 67,190 | 1,710 | 172,435 | 199,322 | 26,887 | 15.6% | 2.6% | 13.0% |
| 186 | 192 | Bend, OR | 64,830 | 65,900 | 1,070 | 156,820 | 191,996 | 35,176 | 22.4% | 1.7% | 20.8% |
| 187 | 184 | Grand Junction-Montrose | 73,360 | 64,160 | -9,200 | 185,874 | 197,495 | 11,621 | 6.3% | -12.5% | 18.8% |
| 188 | 189 | Lafayette, IN | 67,070 | 63,660 | -3,410 | 177,641 | 201,311 | 23,670 | 13.3% | -5.1% | 18.4% |
| 189 | 194 | Twin Falls | 63,540 | 59,990 | -3,550 | 103,765 | 113,560 | 9,795 | 9.4% | -5.6% | 15.0% |
| 190 | 186 | Lima | 70,690 | 59,440 | -11,250 | 106,773 | 102,663 | -4,110 | -3.8% | -15.9% | 12.1% |
| 191 | 185 | Meridian | 72,280 | 59,030 | -13,250 | 186,238 | 177,048 | -9,190 | -4.9% | -18.3% | 13.4% |
| 192 | 191 | Great Falls | 64,910 | 56,270 | -8,640 | 166,382 | 168,282 | 1,900 | 1.1% | -13.3% | 14.5% |
| 193 | 187 | Greenwood-Greenville | 70,050 | 55,640 | -14,410 | 211,374 | 186,441 | -24,933 | -11.8% | -20.6% | 8.8% |
| 194 | 193 | Parkersburg | 63,760 | 53,750 | -10,010 | 156,525 | 151,865 | -4,660 | -3.0% | -15.7% | 12.7% |
| 195 | 195 | Eureka | 60,900 | 53,630 | -7,270 | 161,153 | 164,201 | 3,048 | 1.9% | -11.9% | 13.8% |
| 196 | 196 | San Angelo | 54,980 | 52,790 | -2,190 | 144,134 | 153,308 | 9,174 | 6.4% | -4.0% | 10.3% |
| 197 | 198 | Cheyenne-Scottsbluff | 54,120 | 51,200 | -2,920 | 138,385 | 148,341 | 9,956 | 7.2% | -5.4% | 12.6% |
| 198 | 197 | Casper-Riverton | 54,340 | 48,240 | -6,100 | 147,462 | 153,186 | 5,724 | 3.9% | -11.2% | 15.1% |
| 199 | 199 | Mankato | 52,230 | 47,370 | -4,860 | 120,886 | 123,303 | 2,417 | 2.0% | -9.3% | 11.3% |
| 200 | 200 | Ottumwa-Kirksville | 51,270 | 40,840 | -10,430 | 125,420 | 125,692 | 272 | 0.2% | -20.3% | 20.6% |
| 201 | 201 | St. Joseph | 46,840 | 40,200 | -6,640 | 156,195 | 155,238 | -957 | -0.6% | -14.2% | 13.6% |
| 202 | 202 | Fairbanks | 37,110 | 32,880 | -4,230 | 299,779 | 304,582 | 4,803 | 1.6% | -11.4% | 13.0% |
| 203 | 205 | Victoria | 31,260 | 30,540 | -720 | 85,762 | 92,035 | 6,273 | 7.3% | -2.3% | 9.6% |
| 204 | 203 | Zanesville | 32,550 | 29,180 | -3,370 | 85,874 | 86,183 | 309 | 0.4% | -10.4% | 10.7% |
| 205 | 206 | Helena | 27,040 | 26,440 | -600 | 61,747 | 68,700 | 6,953 | 11.3% | -2.2% | 13.5% |
| 206 | 204 | Presque Isle | 31,270 | 24,740 | -6,530 | 72,542 | 67,111 | -5,431 | -7.5% | -20.9% | 13.4% |
| 207 | 207 | Juneau | 25,250 | 22,940 | -2,310 | 226,687 | 225,255 | -1,432 | -0.6% | -9.1% | 8.5% |
| 208 | 208 | Alpena | 17,520 | 14,430 | -3,090 | 41,405 | 38,722 | -2,683 | -6.5% | -17.6% | 11.2% |
| 209 | 209 | North Platte | 15,250 | 12,830 | -2,420 | 39,893 | 38,769 | -1,124 | -2.8% | -15.9% | 13.1% |
| 210 | 210 | Glendive | 3,940 | 3,590 | -350 | 12,855 | 12,687 | -168 | -1.3% | -8.9% | 7.6% |
InMyArea Research team compiled the 2009 and 2019 Nielsen DMA Rankings and the 2008 and 2018 US Census Bureau population estimates to conduct this analysis.